SecurityAnalyticsThatSpeaksEveryStakeholder'sLanguage
Stop translating security data into business language. Strobes handles it instantly. Live risk trends, remediation velocity, and compliance evidence, all driven by Strobes AI and purpose-built for every stakeholder from the boardroom to the engineering team.

Daysbuildingreports.Minutesofattention.
Security leaders spend 15-20 hours per month compiling reports from multiple tools. They pull data from scanners, normalize it in spreadsheets, build charts, write narratives, and deliver a deck that gets five minutes of boardroom discussion.
Meanwhile, practitioners drown in dashboards that show everything except what they need: which findings are overdue, who owns them, and whether the backlog is growing or shrinking.
The data exists. The insights don't. At least not in a format that drives decisions.
AI-powered insights for every audience
From real-time risk gauges to board-ready compliance reports, every visualization is purpose-built for its audience.
AI Insights Dashboards
Strobes AI generates dashboard views that surface what matters most. No manual configuration. No drag-and-drop widget setup. The platform analyzes your data and presents the insights your role requires.
- Real-time risk posture across all assets and business units
- Trend analysis showing exposure over time: improving or worsening
- Anomaly detection that flags sudden changes in your risk profile
- Natural-language summaries explaining what the data means
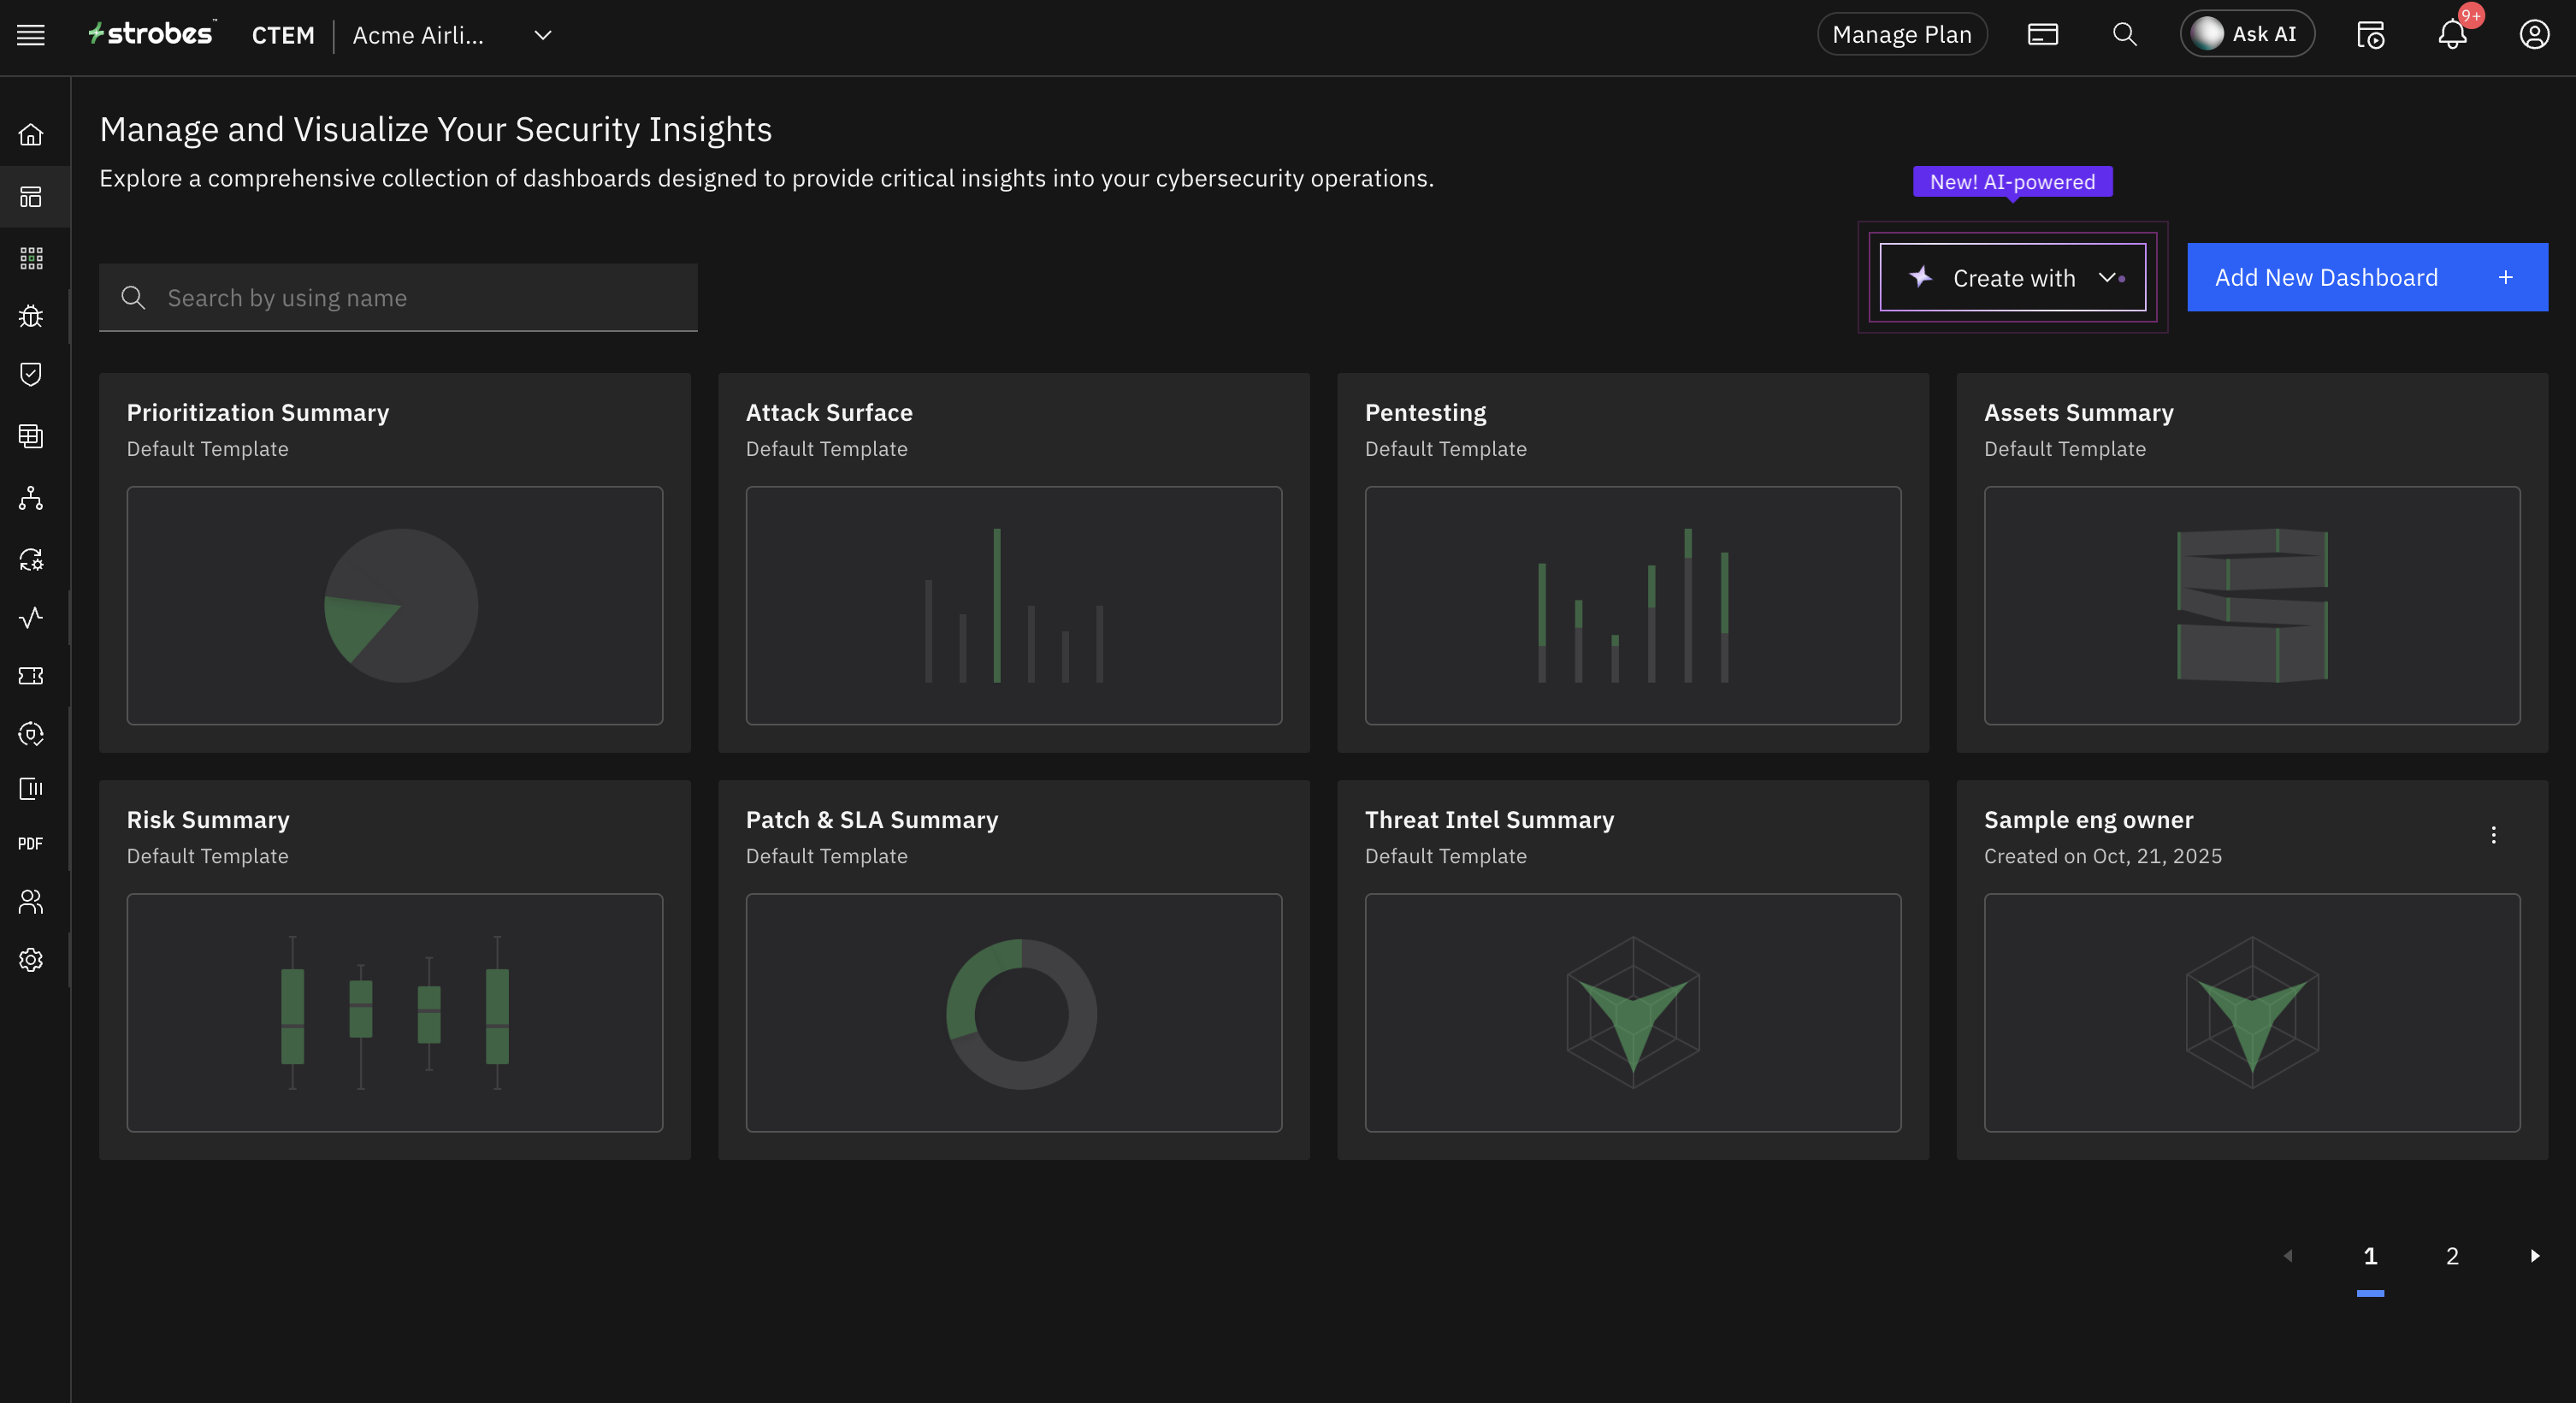
Every metric, one platform
From risk posture scores to SLA compliance, every security insight your team needs — live, verified, and purpose-built for the audience that sees it.
Risk Score Timeline
Risk levels over selected timeframe
Overall Risk Score
CVSS + exploitability + business criticality
Mean Time to Remediate
Resolution speed by severity
Finding Trend by Severity
Historical severity distribution
Findings by State
Current lifecycle distribution
SLA Health Matrix
Service level agreement compliance
Real-Time Risk Posture
Live risk scores combining CVSS, exploitability, and business criticality — updated as findings change.
Remediation Velocity
MTTR by severity, team, and asset type. SLA compliance tracked and enforced automatically.
Compliance Evidence
Auto-generated audit evidence mapped to SOC 2, ISO 27001, PCI DSS, and custom frameworks.
AI-Powered Insights
Natural-language summaries explaining what changed, why it matters, and what action to take.
See What Your Risk Dashboard Looks Like
From raw data to boardroom-ready insights

Collect
Exposure data from all sources, including 100+ integrations, 7 native scanners, and remediation workflows, flows automatically into the analytics engine. No manual data assembly or CSV imports.

Analyze
AI agents identify trends, anomalies, and patterns. Risk scores computed with business context and exploitability data. Remediation velocity tracked against SLA targets. Bottlenecks identified before they become backlogs.
Generate
Reports auto-generated from custom templates with your branding. Executive summaries with natural language insights. Compliance evidence auto-populated. Dashboards update in real time as data changes.

Deliver
Scheduled distribution to stakeholders, with different reports for different audiences. Board gets risk posture and trend direction. Practitioners get backlog metrics and overdue items. Auditors get compliance evidence and remediation timelines.
Purpose-built views for every audience

For CISOs & Security Leaders
Strobes Analytics vs. Manual Reporting


“Iusedtospend20hoursamonthbuildingsecurityreportsfrom8differenttools.NowStrobesgeneratestheminminutes,andthey'rebetterbecausetheyincludeverifiedremediationdata,notjustticketclosures.Theboardactuallyengageswiththesereports.”
CISO
Chief Information Security Officer · Regional Banking Group
Read More Customer Stories
Analytics powered by the full platform
Frequently Asked Questions
Turnyoursecuritydataintodecisionsyourboardactson
Watch Strobes AI generate an executive risk report from live data, complete with trends, remediation metrics, and compliance evidence. In minutes, not days.
- No credit card required
- Setup in 5 minutes
- SOC 2 & ISO 27001